
Case study
Making “Compare” Actually Compare
One native design for comparing advice tiers on iOS and Android: swipeable cards or a table, a fixed row order, and disclosures one tap away.
Screens recreated from public information, with branding removed.
TL;DR
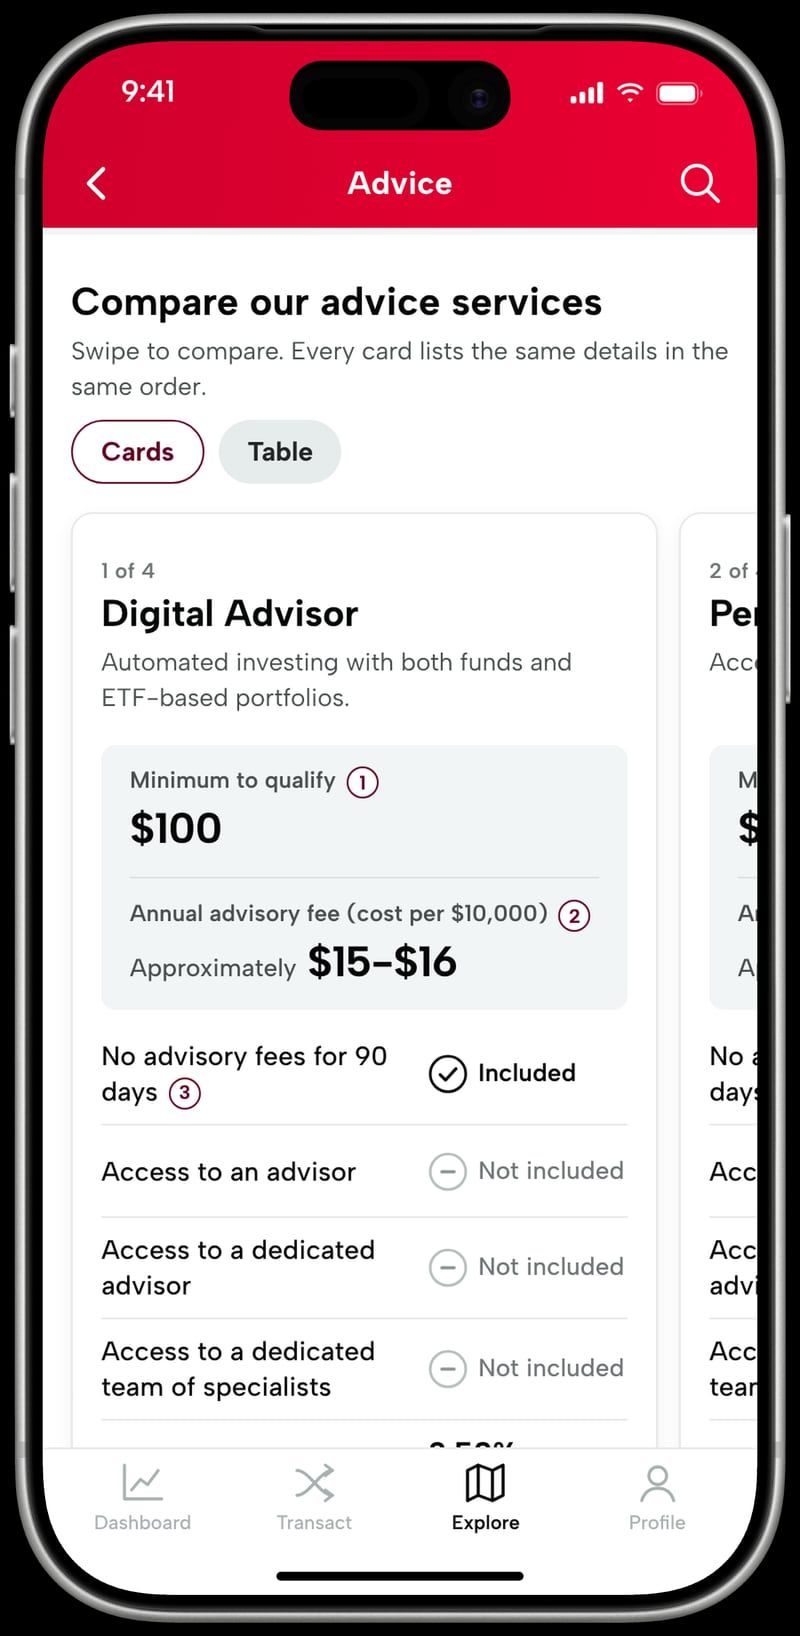
Led the redesign of an advice comparison inside Vanguard’s native investing app, replacing a web view with one native design for iOS and Android. People can swipe through tier cards or switch to a table, every tier shows the same rows in the same order, and disclosures sit one tap from the number they explain. In development, not shipped yet.
Overview
Inside Vanguard’s native investing app, investors choose between four advice tiers, from Digital Advisor to Wealth Management, with minimums from $100 to $5M+. Each tier has its own minimum, fee, and features, plus a lot of required disclosure.
The screen meant to help people choose was called “compare,” but it didn’t let anyone compare. It was a web page loaded into the app. I redesigned it as a native experience, adapted the components for SwiftUI and Kotlin, and worked with the iOS and Android developers and the design systems team so the pieces could be reused well beyond this screen.
The question I kept coming back to: what does “compare” have to mean on a phone?
Challenge
No real comparison
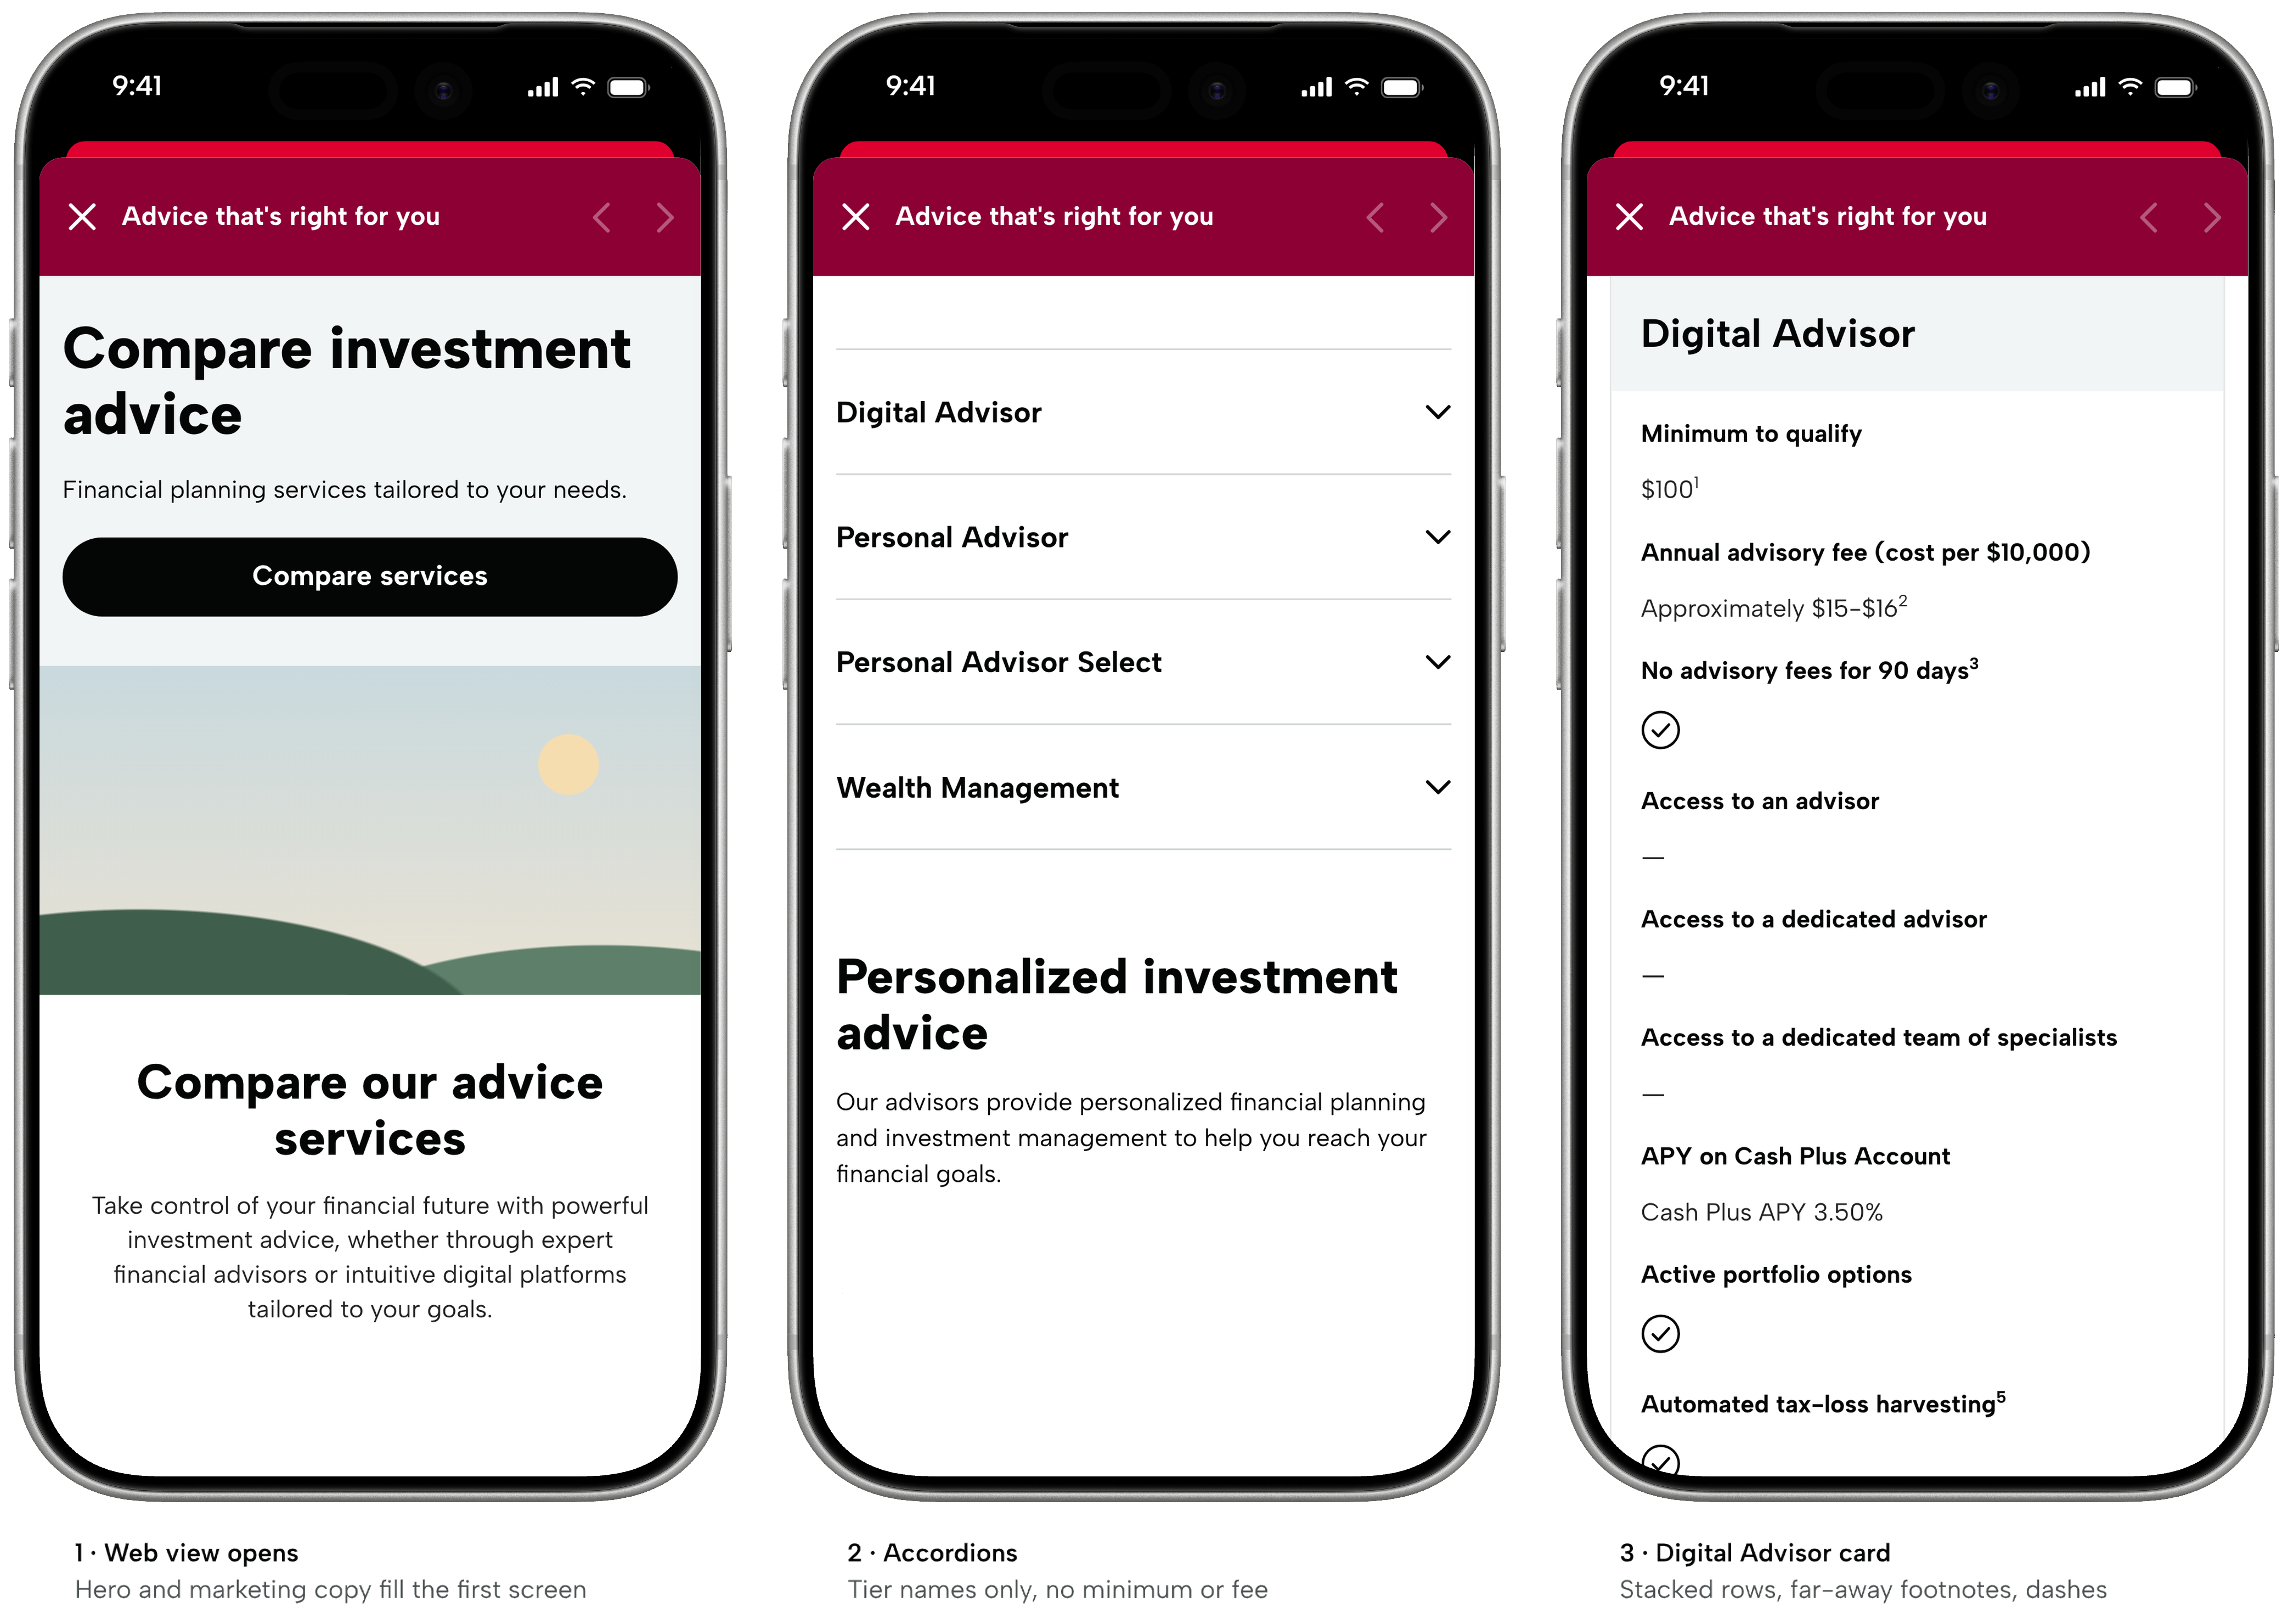
Each tier was a long stacked card. Comparing fees meant scrolling, remembering, and scrolling again.
Felt like a web page
Spacing and type didn’t match the app, and the header’s back and forward arrows looked disabled.
Key numbers buried
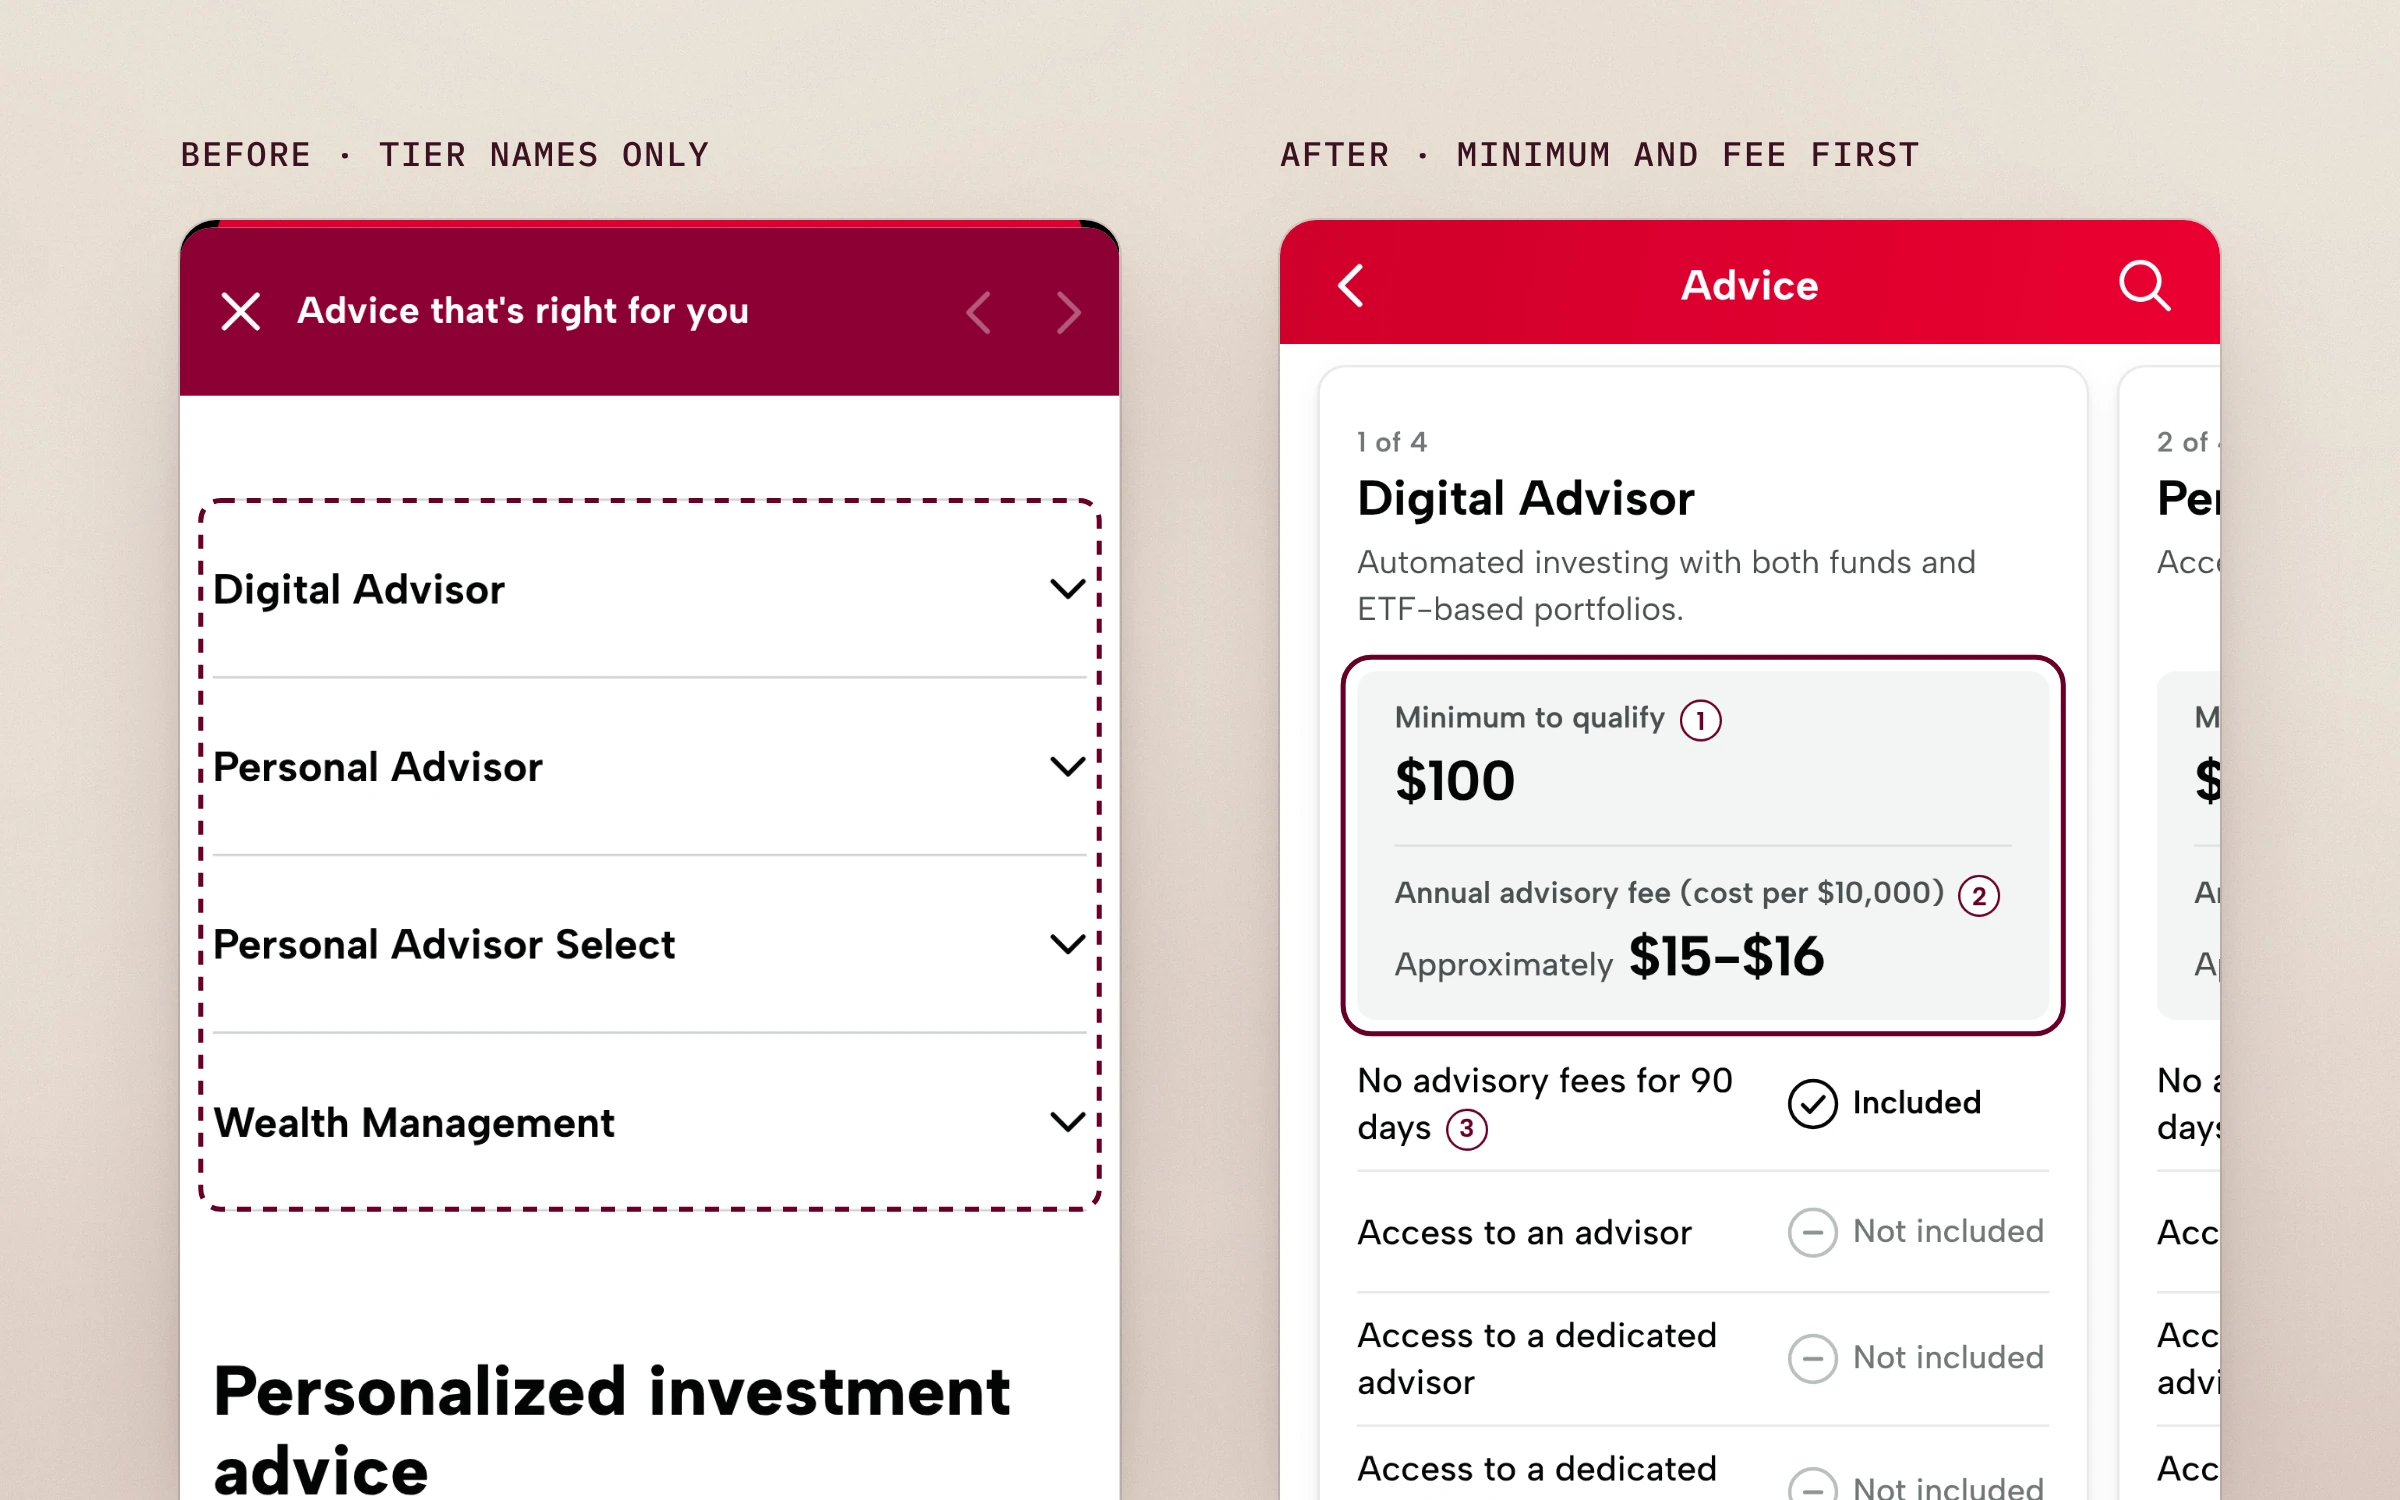
The accordion listed tier names only, with no minimum or fee.
Footnotes and dashes
Superscripts pointed to disclosures far below, and columns of dashes for “not included” made you read what you don’t get.
Solution
I rebuilt it as one native design for iOS and Android, with:
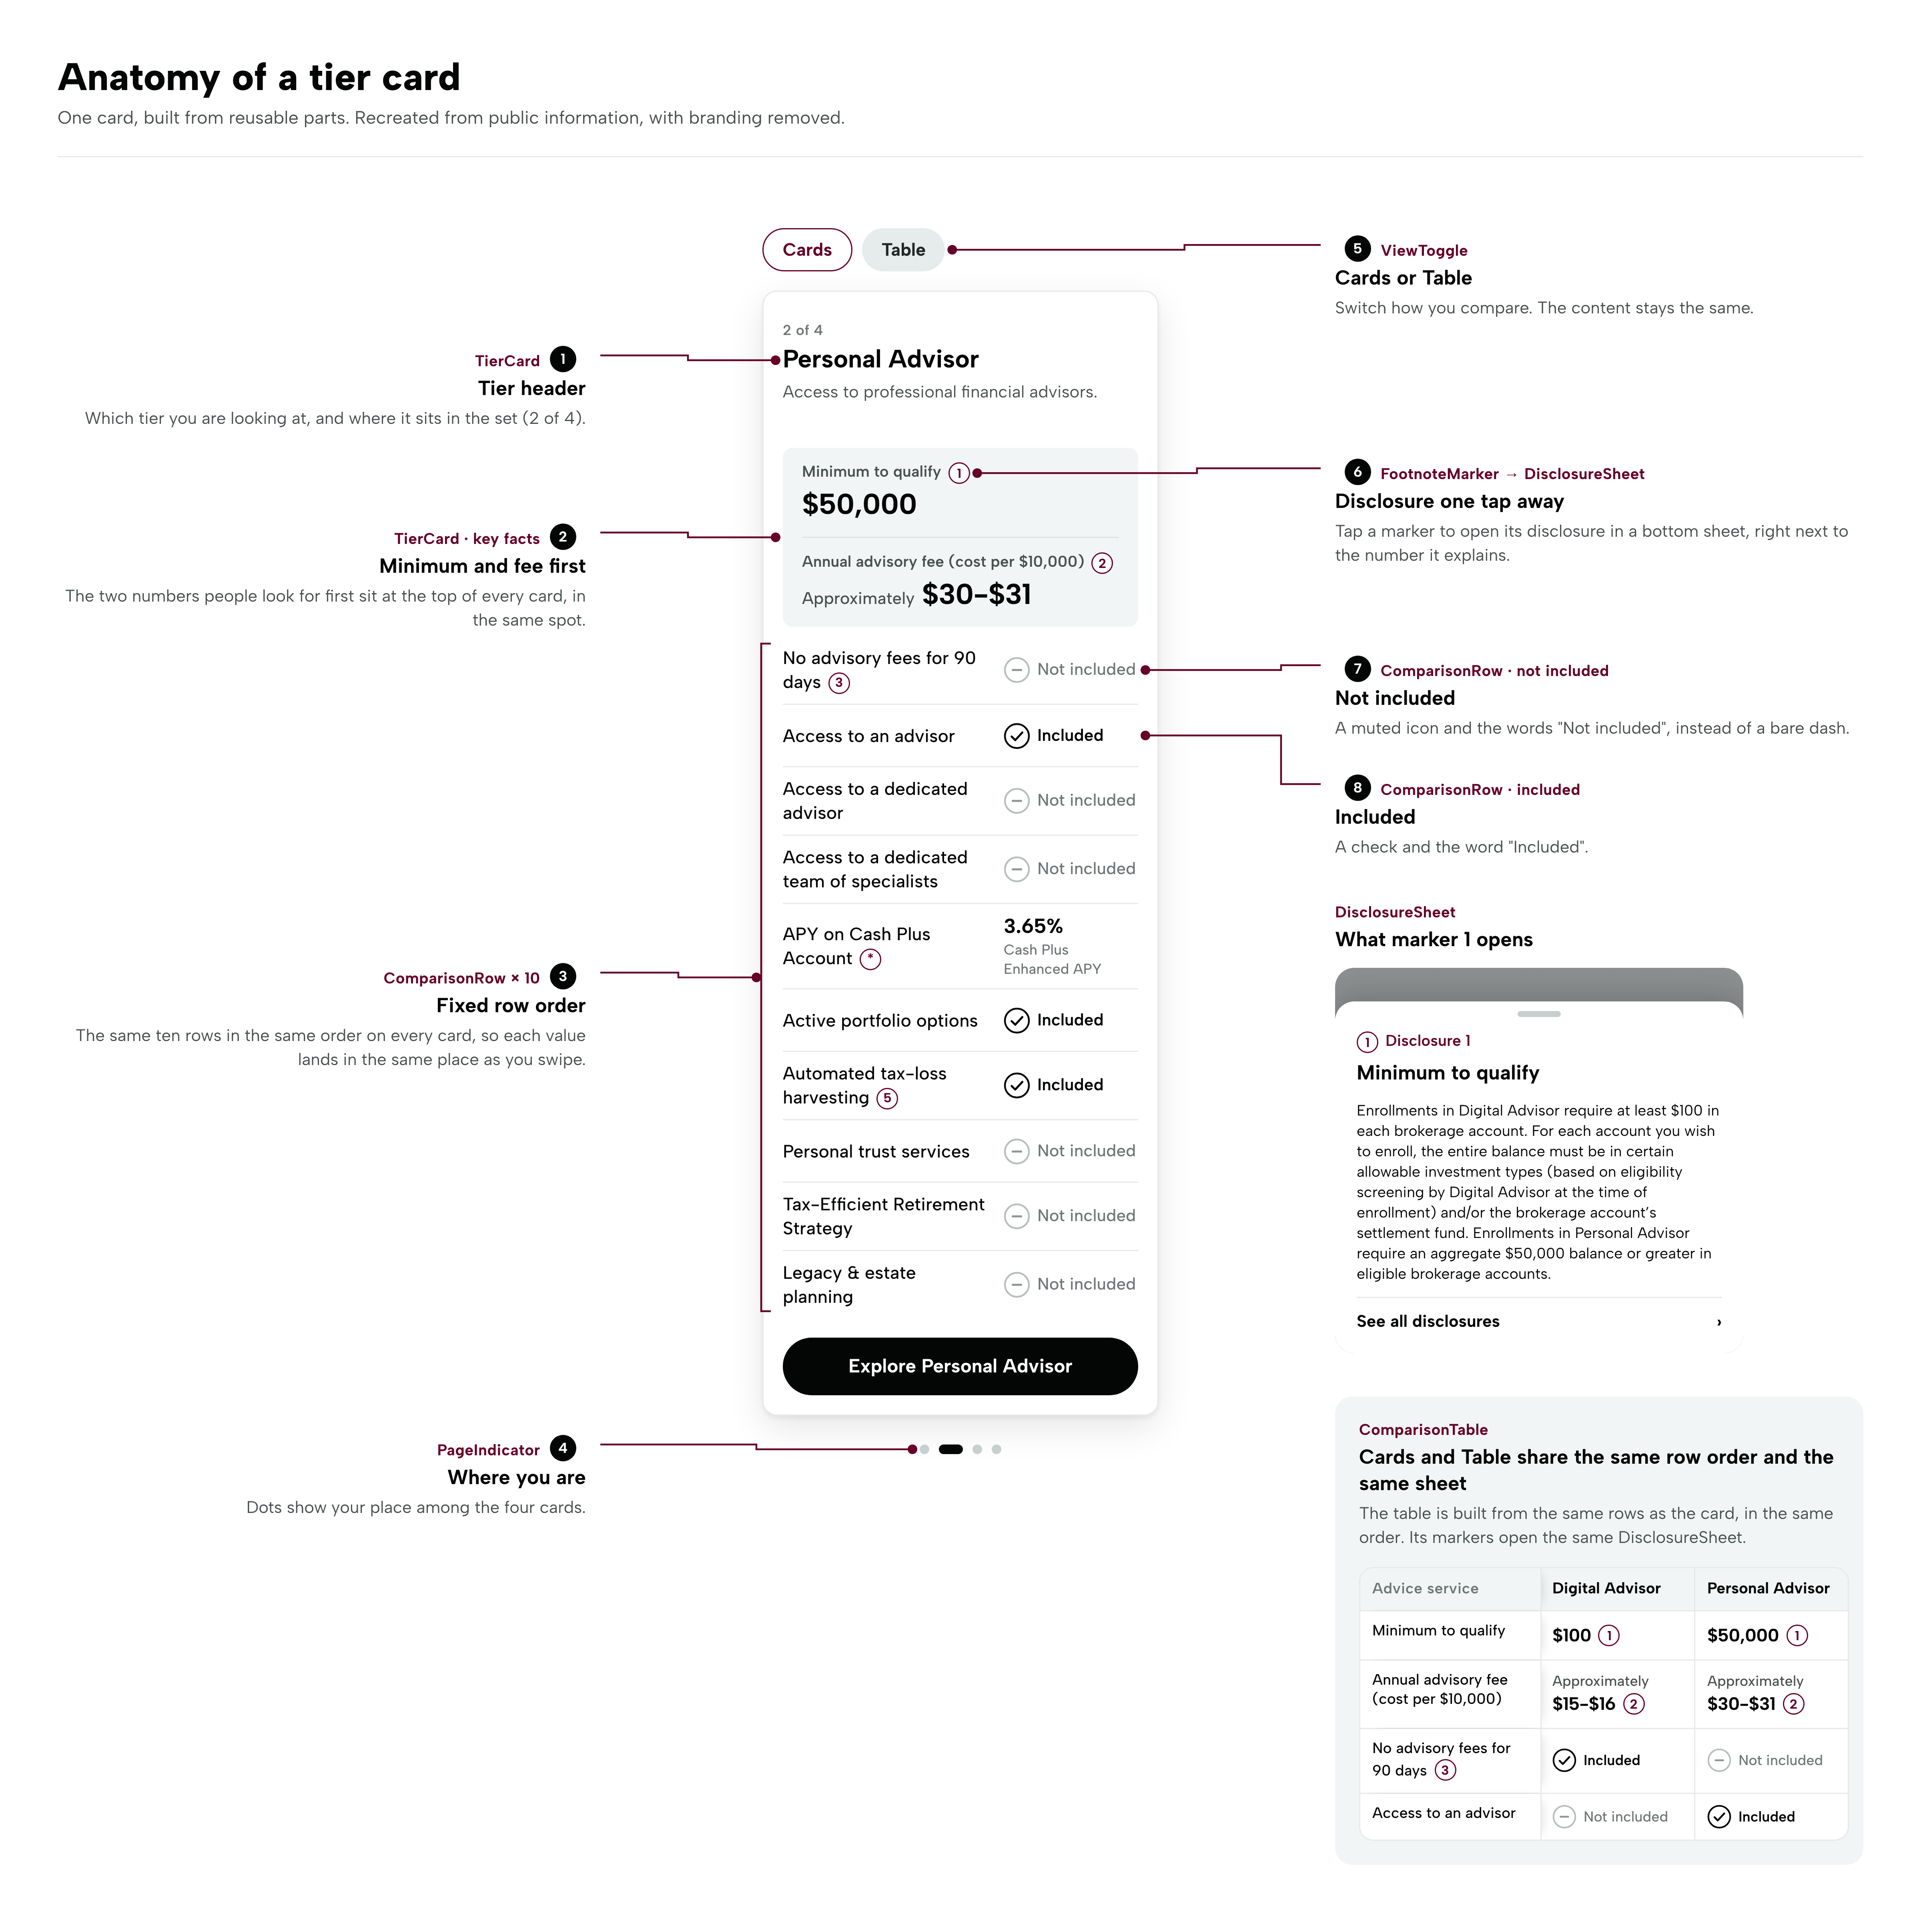
- A Cards / Table toggle, so people choose how they compare
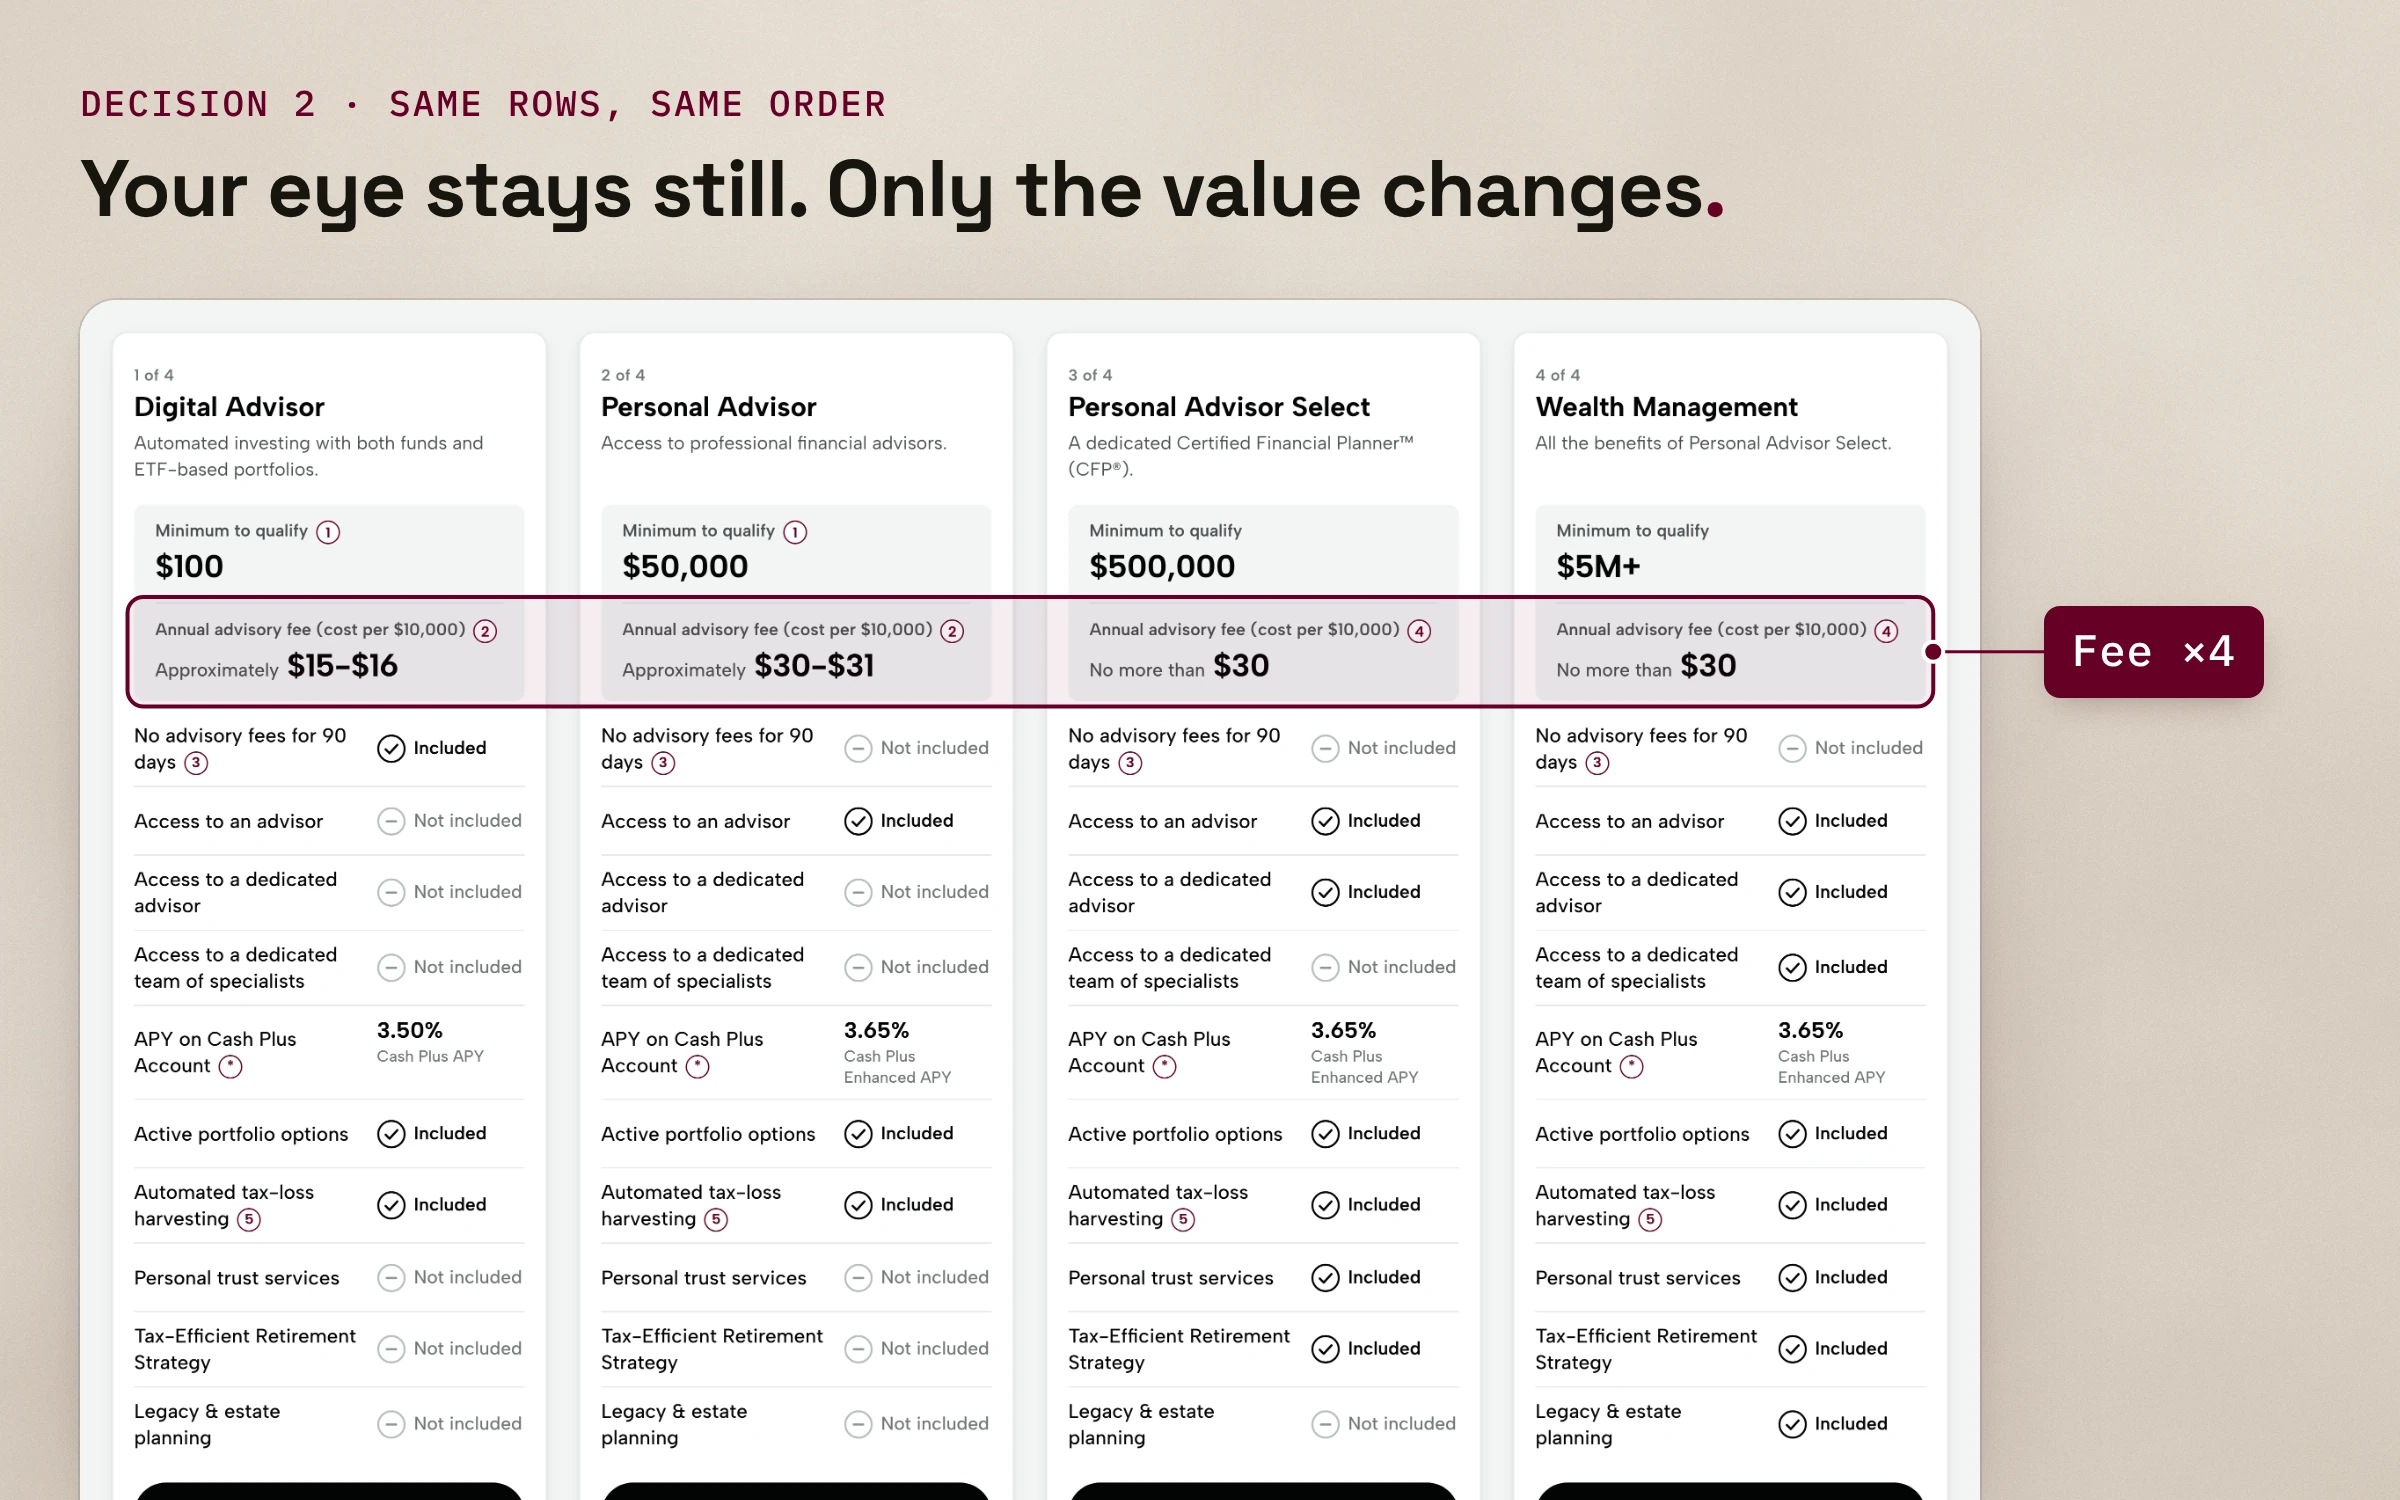
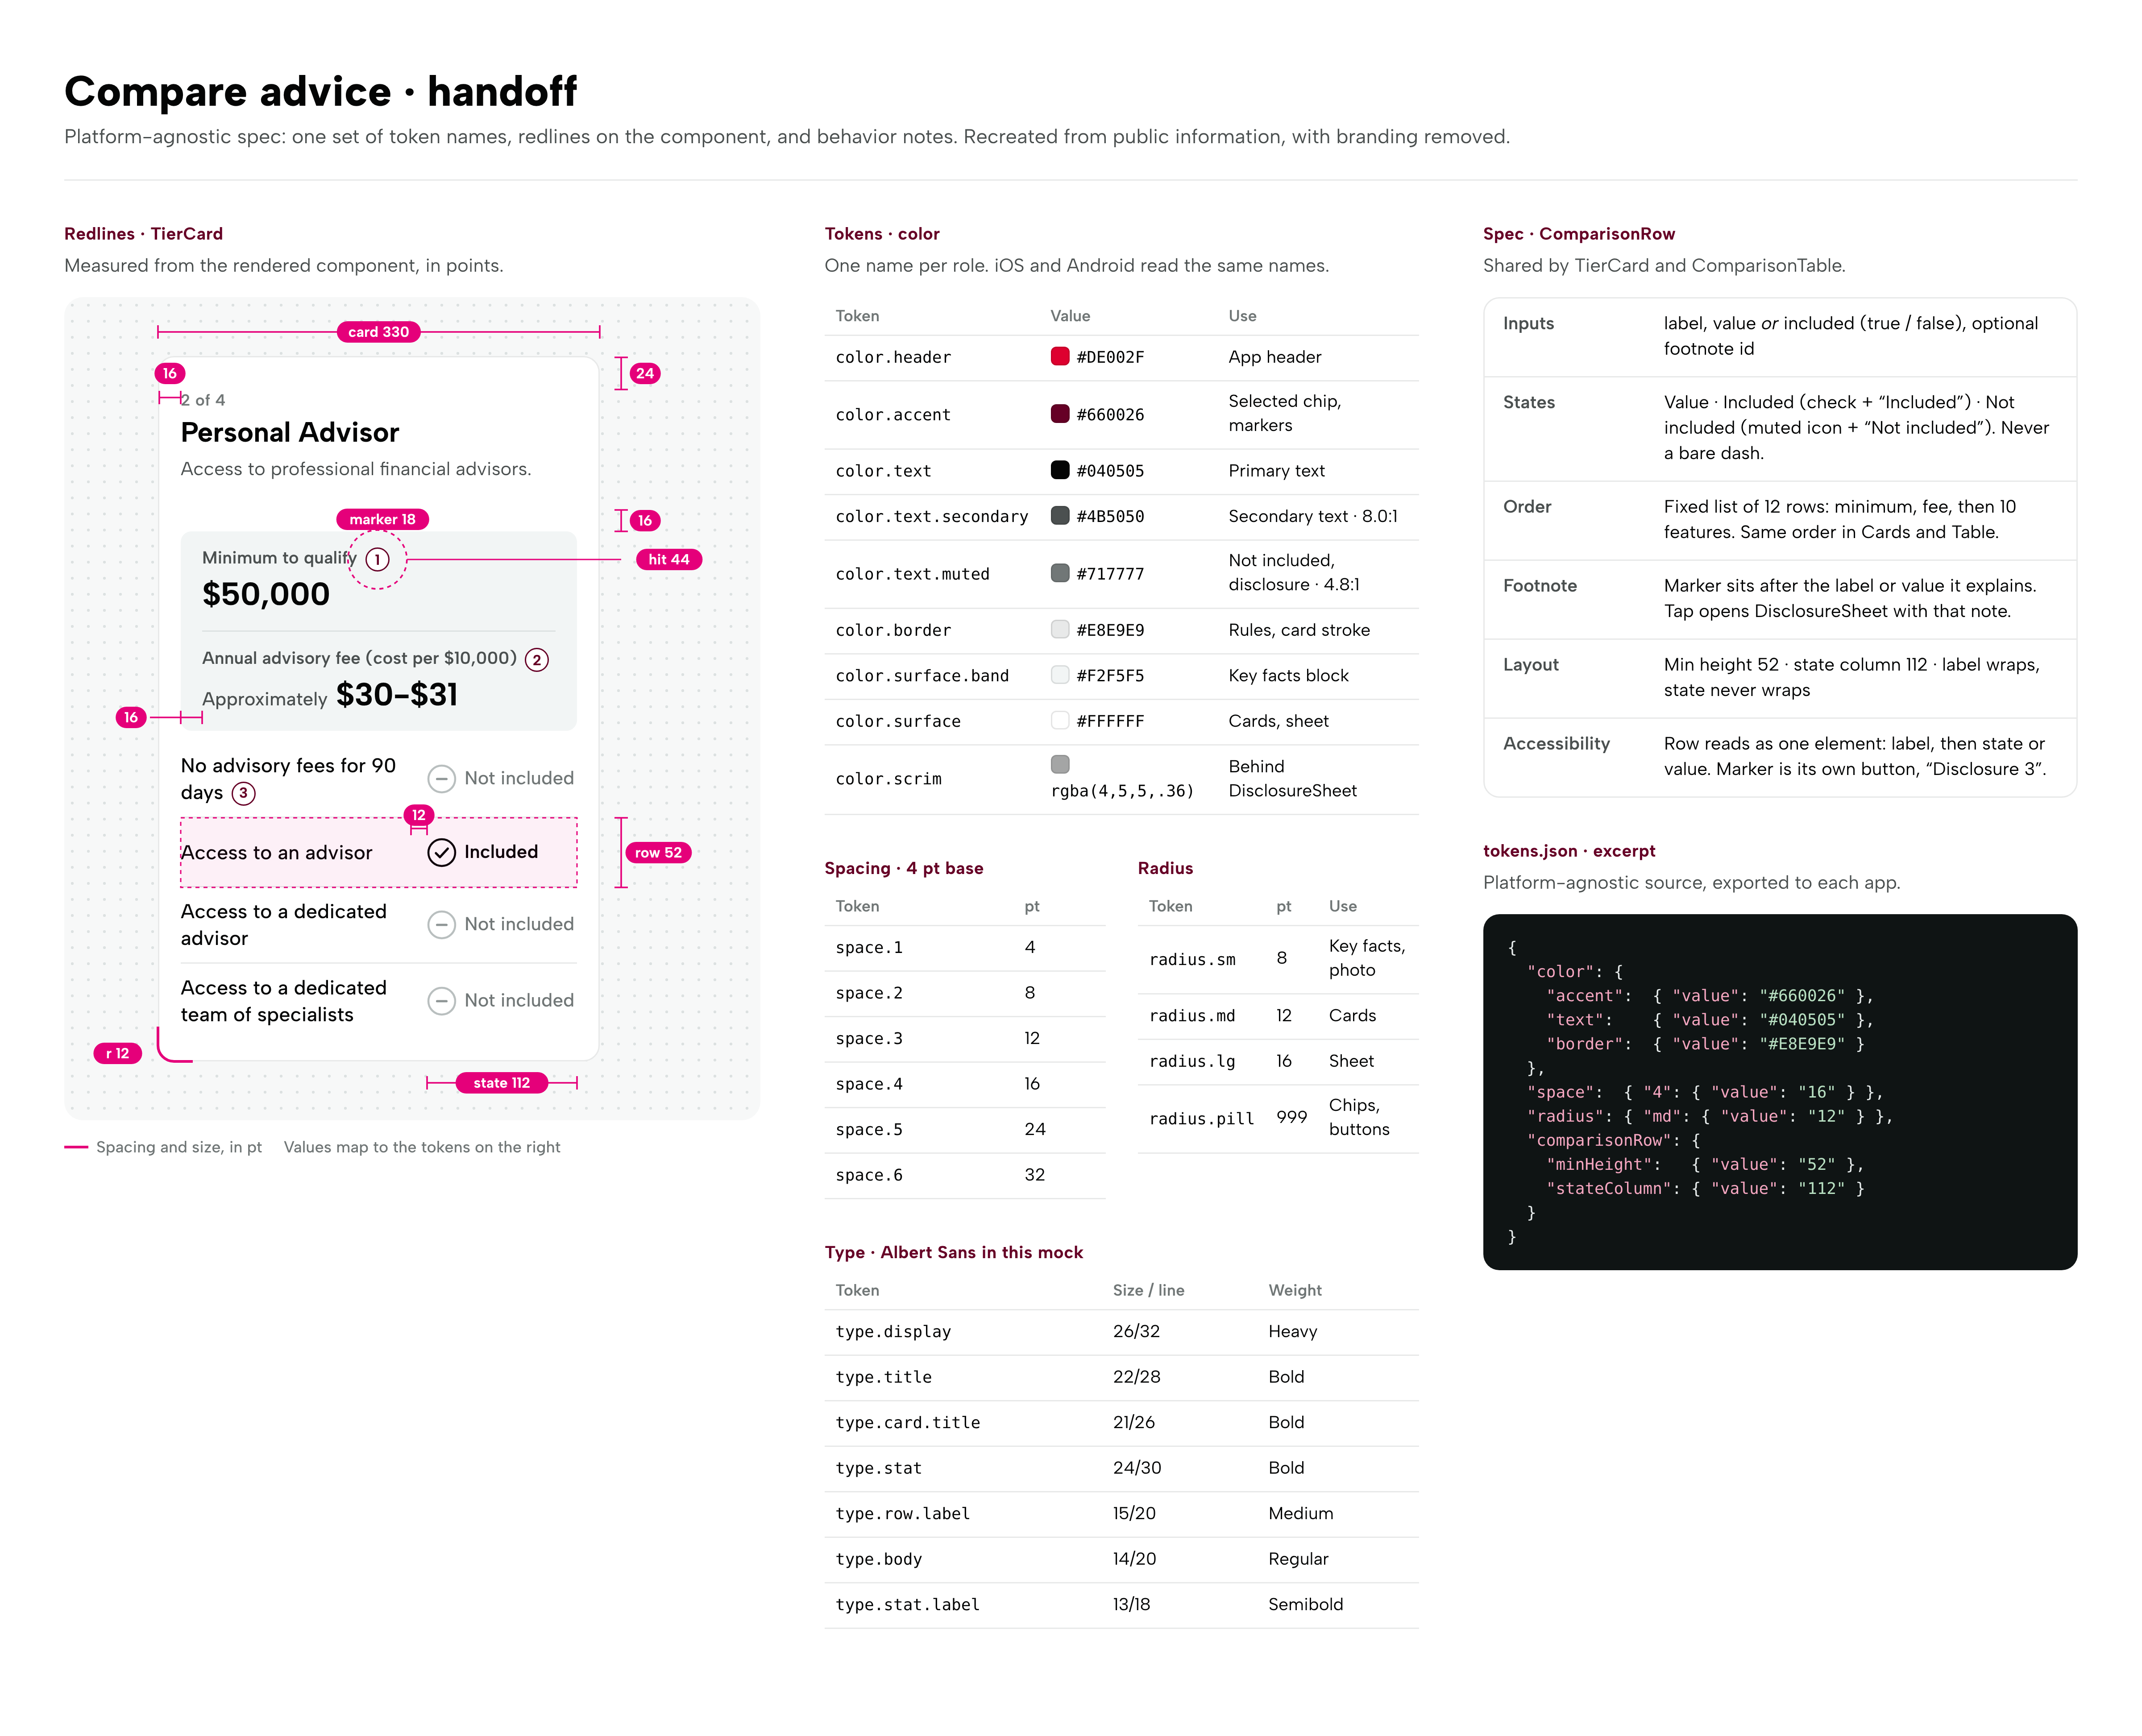
- The same 12 rows in the same order on every tier, minimum and fee first
- Clear “Included” and “Not included” labels instead of dashes
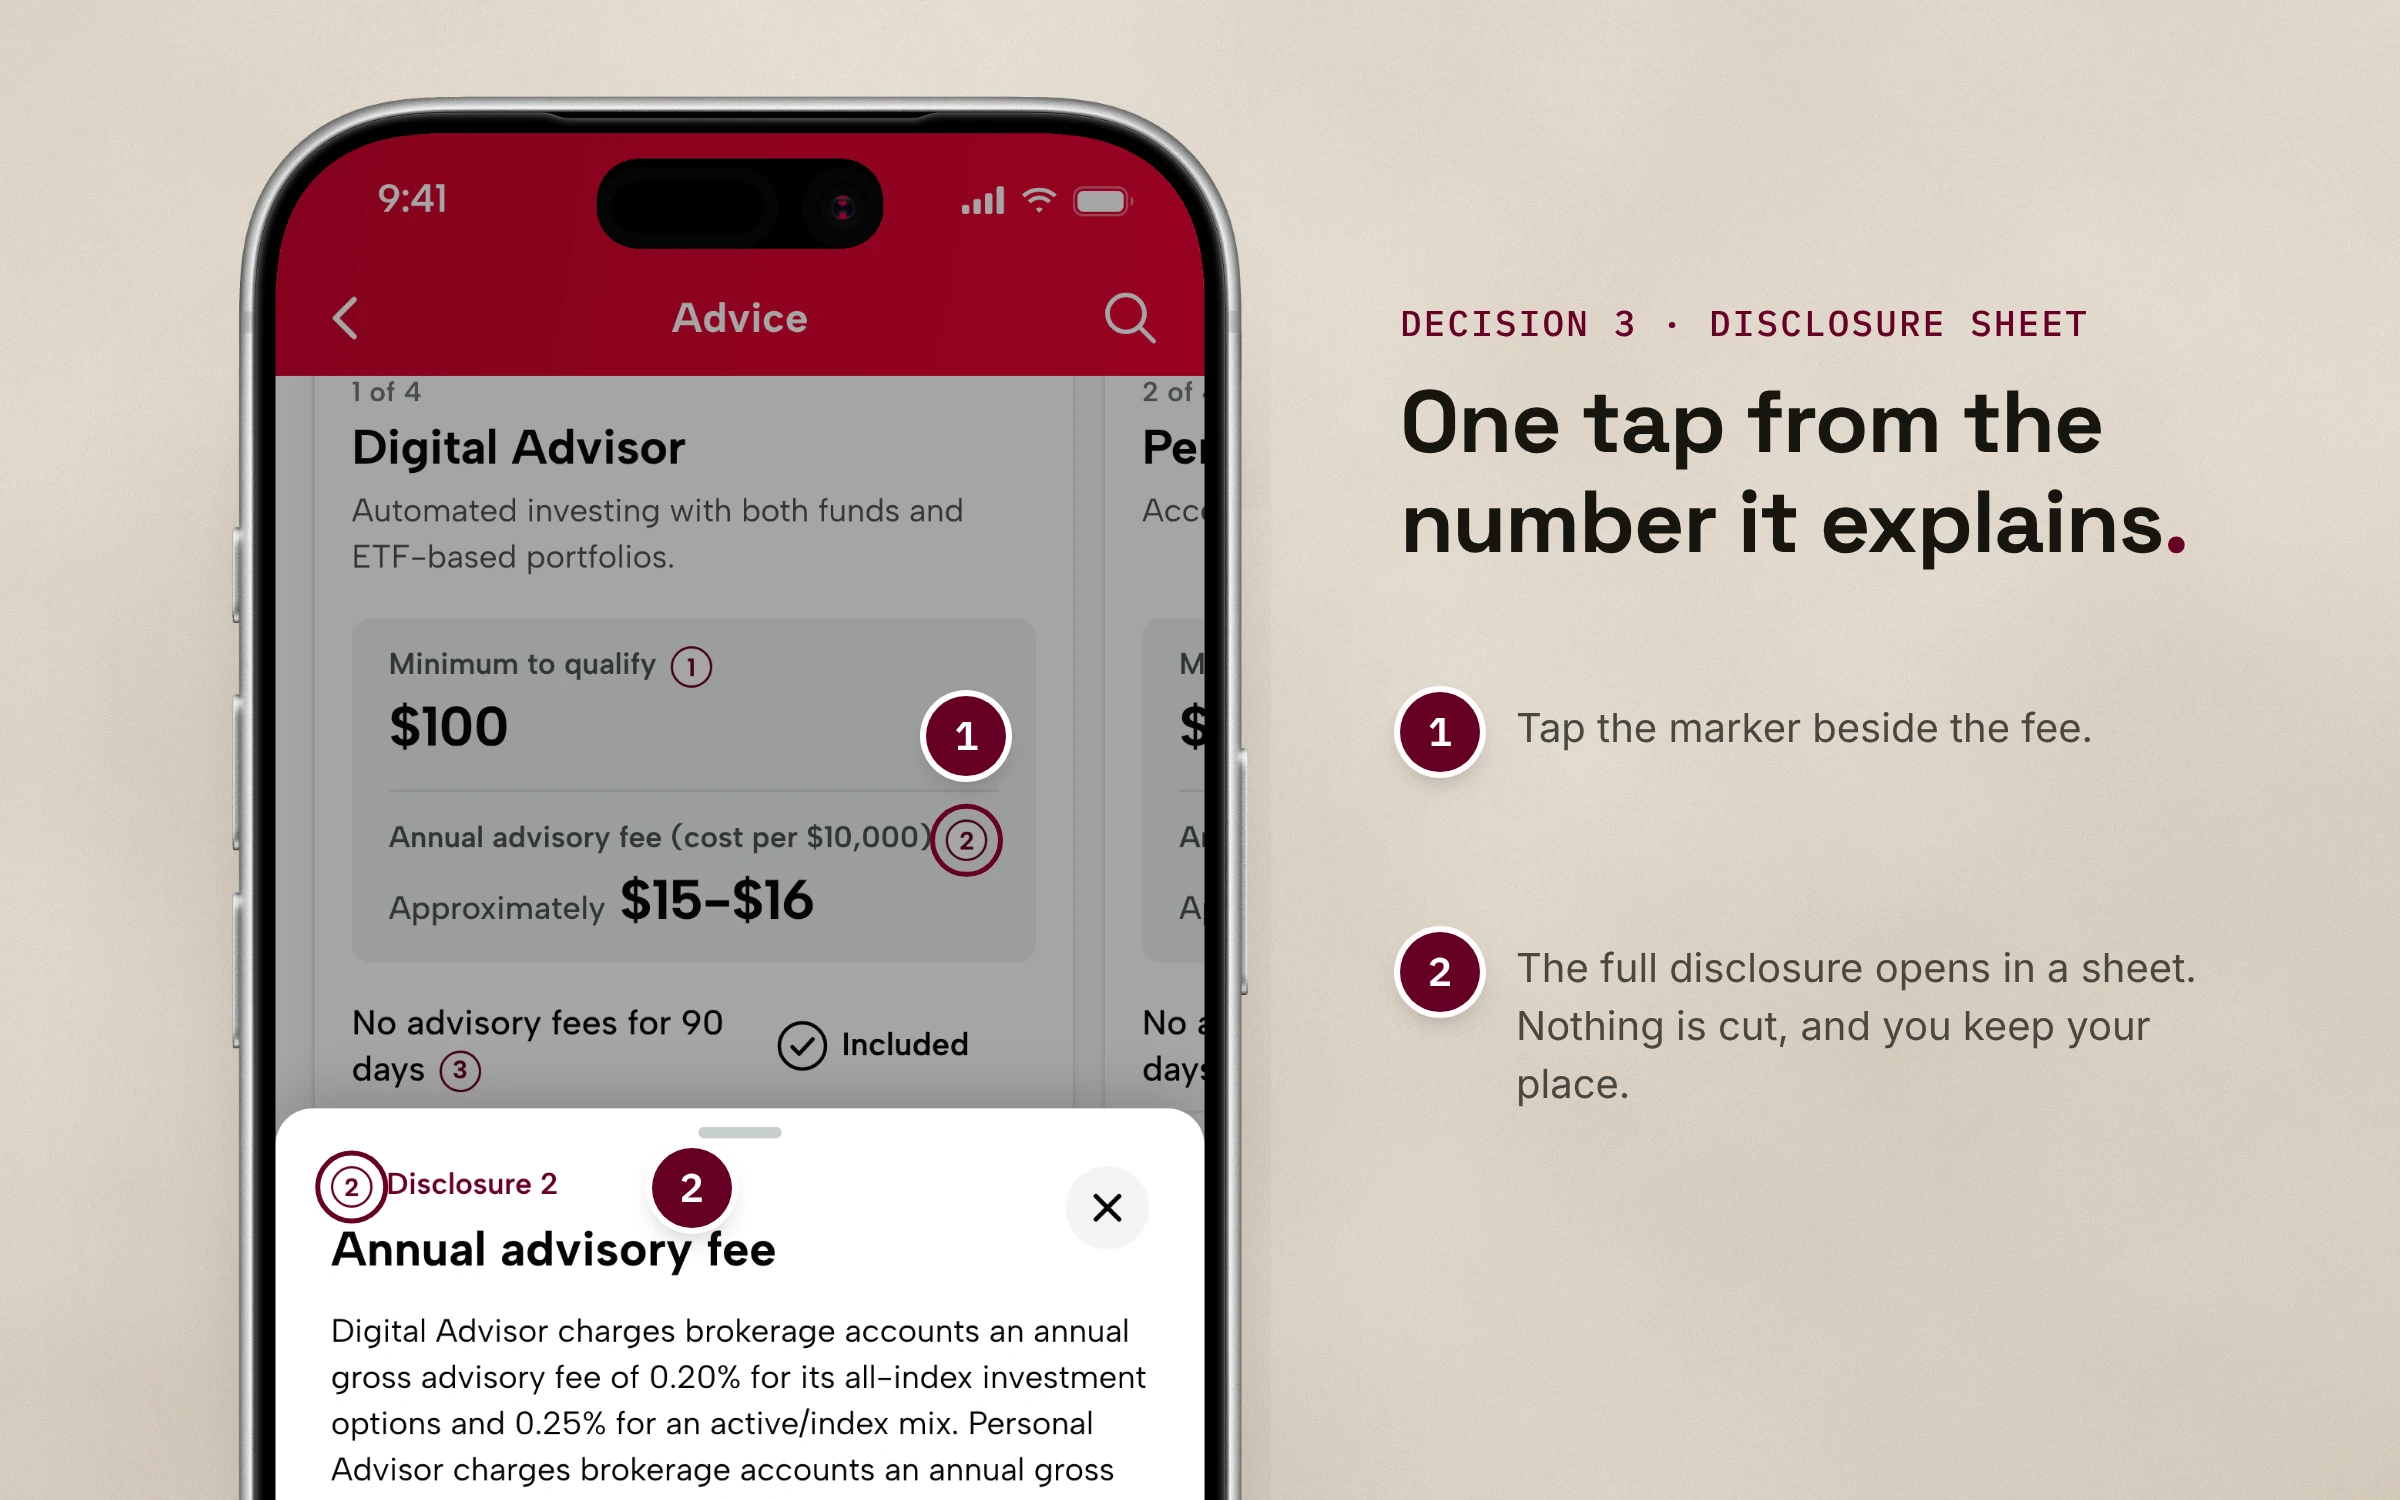
- Disclosures in a bottom sheet, one tap from what they explain
- Reusable components, proposed as design system patterns and accepted
One comparison. Two ways to look at it.
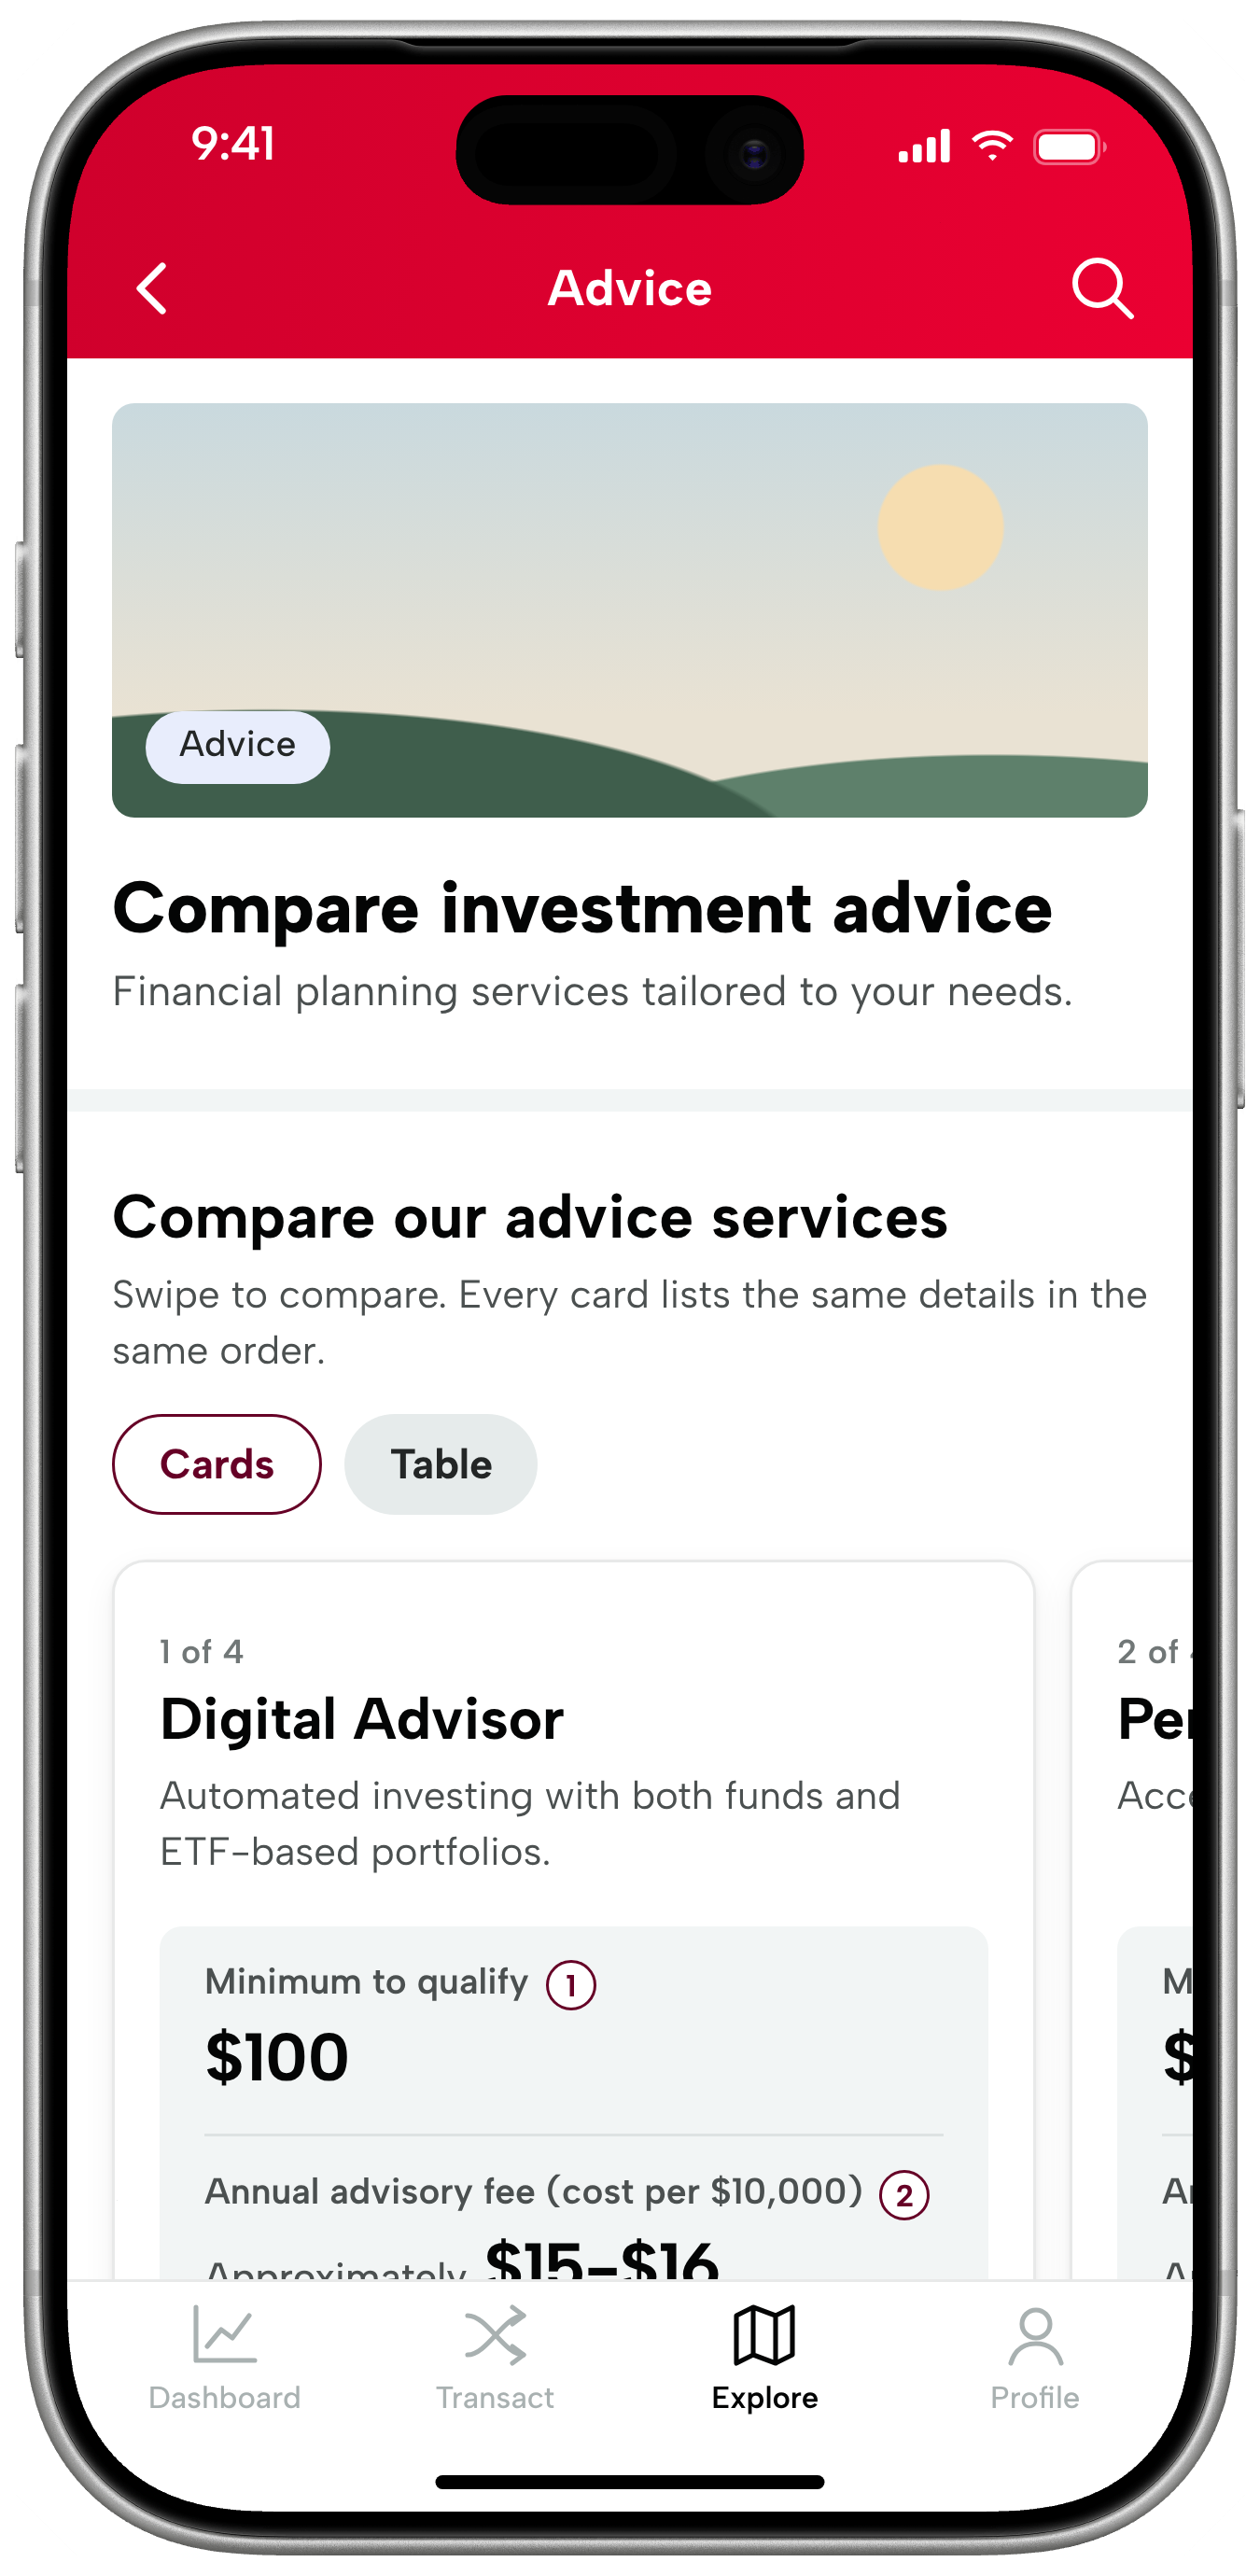
Swipe one tier at a time.
Same rows, same order.
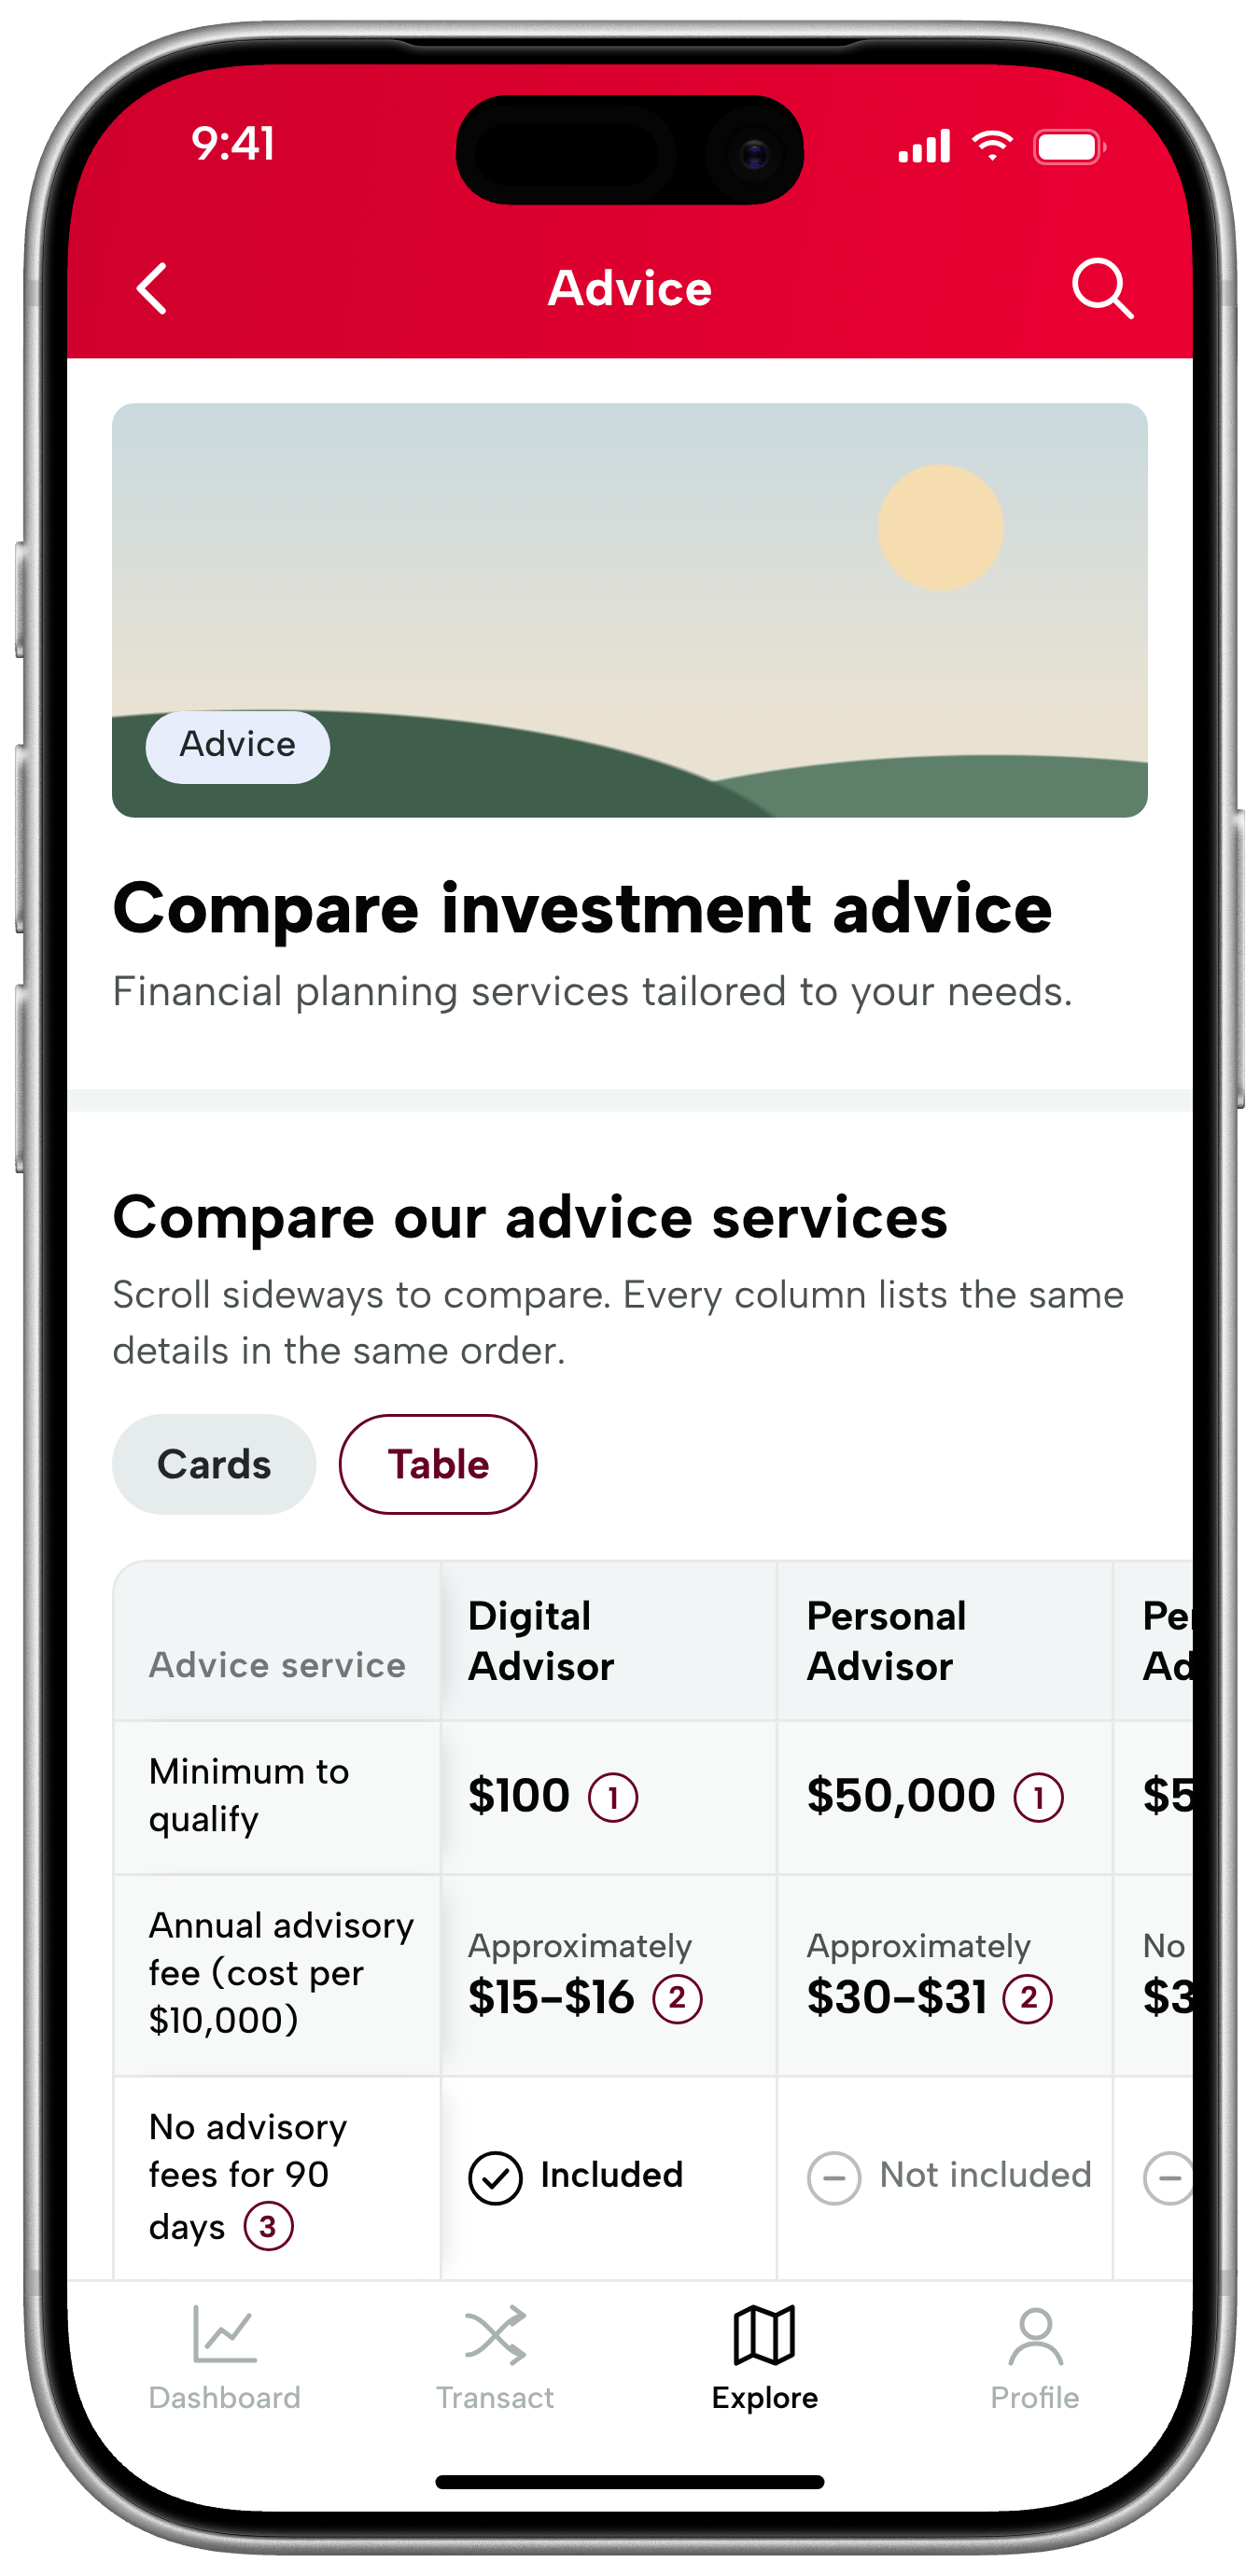
Scan all four tiers at once.
Same rows, same order.

Why it mattered
There was no formal research study on this project. This section covers what user feedback and the team told me.
This one screen was costing something for everyone who touched it:
- Investors: user feedback said the tiers were hard to compare
- Stakeholders: wanted the advice products positioned better
- Developers: kept recreating the same components, screen after screen
- QA: kept testing the same things over and over
Fixing the comparison would help investors decide, and building it the right way would stop the team rebuilding and retesting the same parts.
Design Decisions
A look at the key design moves, made inside three limits: disclosures can’t be cut, one design has to work on two platforms, and everything has to fit the design system.
- Cards or a table. People compare differently, so a toggle lets them swipe one tier at a time or scan them all. Both views use the same rows in the same order.
- Fixed row order, basics first. Every tier starts with the minimum and fee, and every row stays in the same spot. “Included” and “Not included” replace the dashes. The tier-name accordion stays.
- Footnotes in a bottom sheet. The legal text stays complete. It moves next to what it explains, one tap away in either view.
- One platform-agnostic spec. Designed once and specified to behave the same on iOS and Android.
- Components built to be reused. The parts a comparison is made of were proposed as design system patterns. The proposal was accepted.
Outcome
The redesign is in development, not shipped, so I’m not claiming any results. I worked directly with the iOS and Android developers (docs, tokens and designs) and with the design systems team, and the pattern contribution was accepted into the system.
Status:
- In development on iOS and Android
- Pattern proposal accepted into the design system
- Analytics being built to show how often, when and where people open disclosures (no findings yet)
What I’ll measure once it’s live (plans, not results):
- Comparison engagement: do people swipe past the first card, and which view do they pick?
- Advice enrollment starts from this screen
- Whether feedback still says the tiers are hard to compare
- Component reuse by other teams, and less repeat work for developers and QA
Reflection
A screen called “compare” only compares if the layout lets you hold two things side by side, one swipe or one row apart. Keeping every row in the same place did more than adding detail, and required disclosures didn’t have to be in the way. The visible problem was the screen; the hidden one was rebuilt components and retests, so the best mobile fix turned out to be a systems fix.
What’s next: the pattern layer. The design system stopped at atoms, molecules and organisms. The next case study is about the layer of reusable patterns I defined on top, now accepted into the system.